Team capability & skill gaps
Coaching one person is about their development. Sometimes the question is bigger: does this team collectively have the skills for what’s coming? Before a project, a reorg, or a busy season, you want to see where the group is strong, where it’s thin, and who to develop or hire. You read that from the same skill records you build while coaching: each person’s standing against the bar their role sets, across everyone on the team.
Read across the team
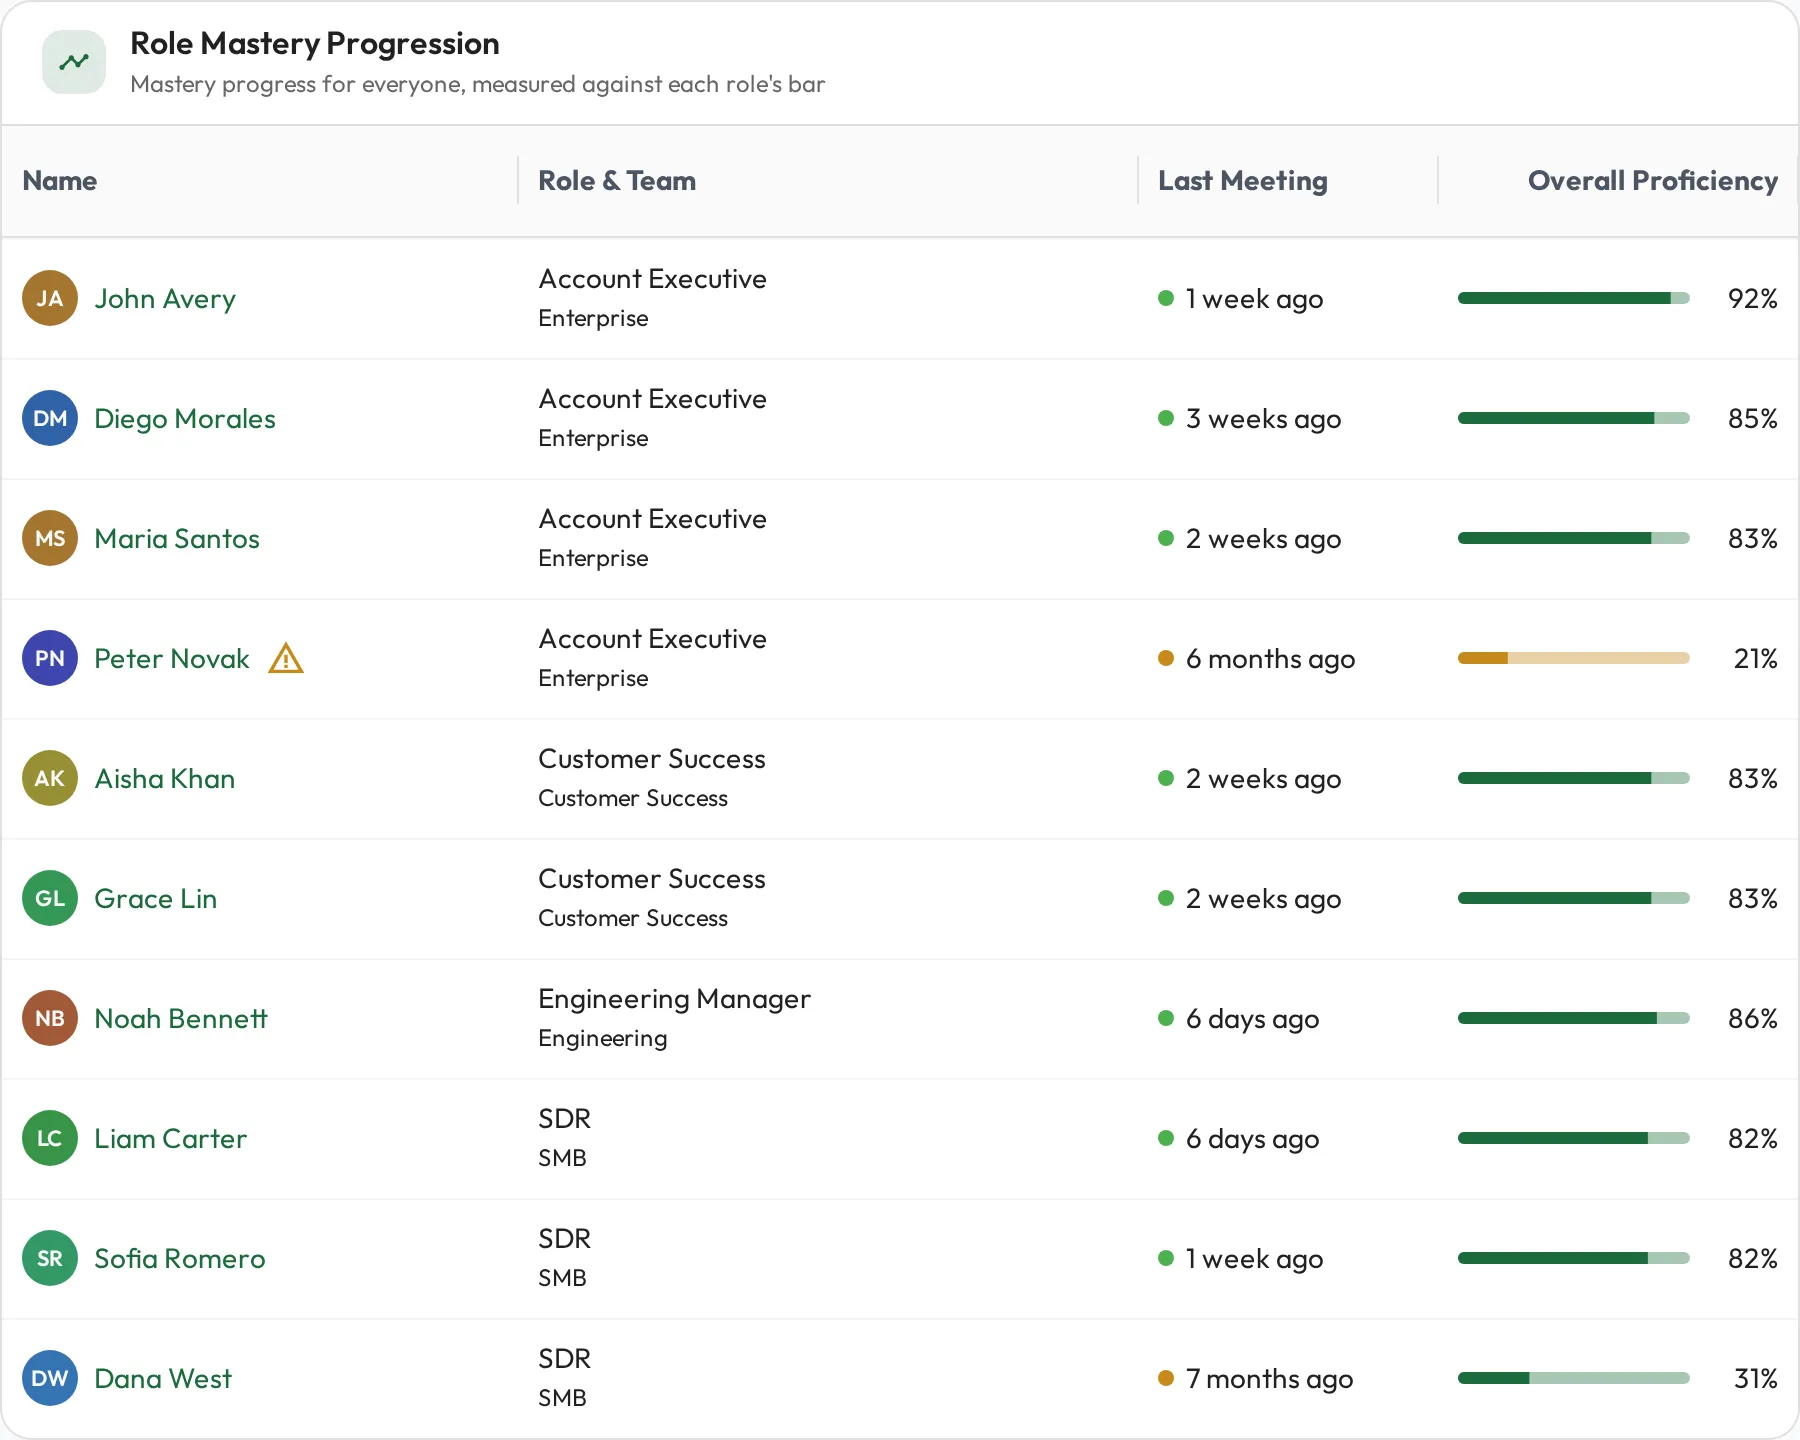
Section titled “Read across the team”A role sets the required-skill bar for the job, and a team groups the people doing it. The Role Mastery report puts the whole team in one grid against that bar: each member’s overall proficiency against the skills their role expects, side by side, so you see at a glance who is covered and who is thin. Because the role’s required skills are the same checklist for everyone in it, the comparison is apples to apples, and anyone sitting well below the bar is flagged for you.
Read skill by skill with the Skills Heatmap
Section titled “Read skill by skill with the Skills Heatmap”Role Mastery gives you one number per person. To see which skill is thin, open the Skills Heatmap: the role’s skills run down the side and its members across the top, one cell per person per skill.
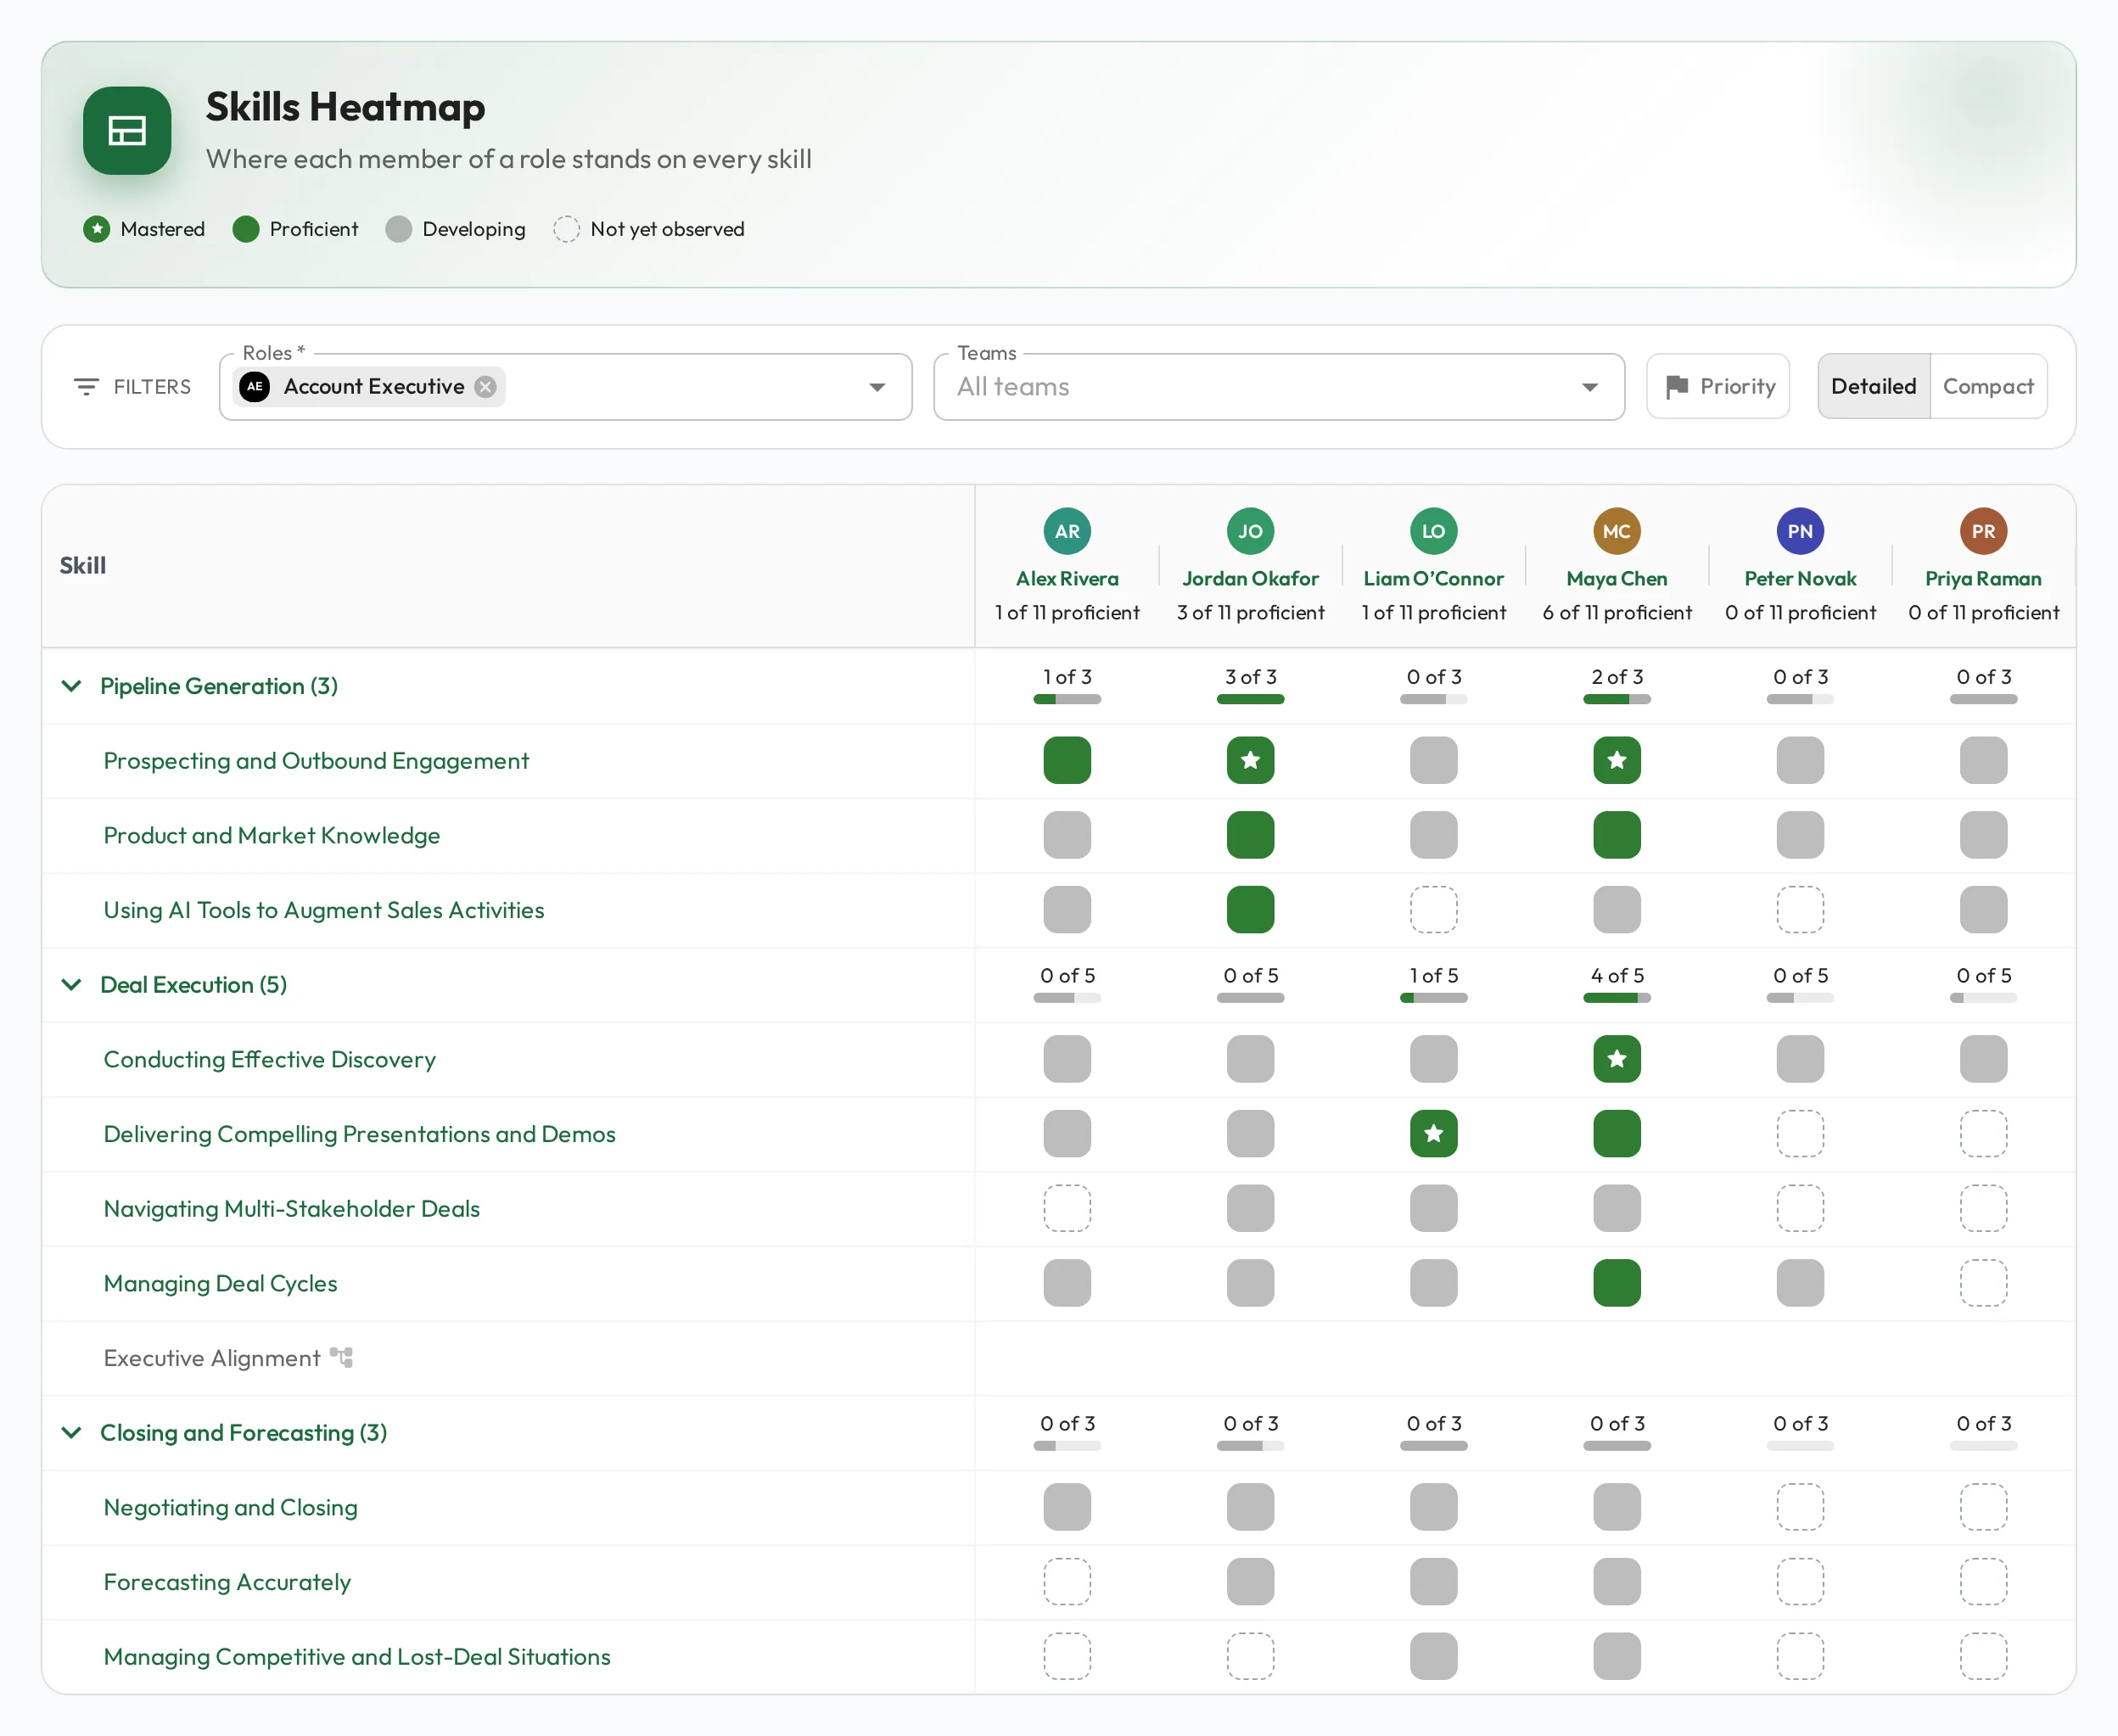
Pick one or more Roles to fill the grid, and one or more Teams to narrow it to those people. Type in either field to search; each option shows how many active members it has. Select ✕ on a chip to remove it, or the ✕ at the end of the field to clear them all. With several roles, a cell is left empty where none of the selected roles that person holds includes the skill. Compact fits more people on screen; hover a column for the person’s name. Select a name, or an avatar in Compact, to open that person’s profile.
To look at fewer skills, hover the Skill column header, open its menu (the three dots), and choose Filter. Add a condition on Skill (such as a name that contains a word), Reference ID, or Required (any selected role marks the skill required), and only the matching skills stay, under their group. A match on a nested skill shows the skill that holds it. Filters hide rows only: the count under each person, and each group’s bar, still cover every skill the selected roles ask of them. The filtered view is saved in the page address, so you can bookmark or share it.
| Cell | What it means |
|---|---|
| Mastered | Cleared the mastery bar, and their latest score is a perfect 100. Green with a small white star. |
| Proficient | Cleared the skill’s mastery bar, or the skill is assumed proficient for them. Plain green. |
| Developing | Scored, but not Proficient yet: their latest score was below the threshold, they have not met it in enough sessions in a row, or the skill has no threshold or consecutive sessions set. |
| Not yet observed | No observations yet, or none of them has a score. Drawn as a dashed outline. |
Apart from assumed proficiency, only scores that count toward mastery colour a cell; self-assessments and AI practice do not.
Hover or tap a cell to open its card: what the skill is, the person’s history on it, and how close they are to becoming proficient. The card also marks a skill that is one of their priorities.
To see what each person is focused on, select Priority in the filters on either report. A blue ring then marks each skill prioritized for that person, and the other skills fade so the priorities stand out, here and on the Team Skills squares below.
Read the team’s skill mix
Section titled “Read the team’s skill mix”The Skills Heatmap compares everyone in a role against that role’s skills. The Team Skills report answers a different question: what can this team actually do, given the mix of roles in it? A team of account executives, some of them also SDRs, is a mix rather than one ladder, so each person is read against what their own roles ask of them.
The report opens on a card per team. Pick one, or switch later with the Team field (type to search; each team shows how many active members it has), and you get a card per active member. The cards are built to keep that question in focus:
- Grouped by skillset. Each row on a card is a skillset, so you read the team at the level you plan around rather than item by item. Skills outside any skillset sit under “Other skills”.
- Skills, not behaviours. Each square is a skill directly under a skillset. Behaviours don’t get squares.
- A Composite skill counts as one. It shows as one square that sums up the skills inside it that the role asks for.
- Only what the role asks for. Any other skill appears only when the role asks for it directly.
- A section per role. A member with more than one role gets a section per role, and a skill two of their roles share appears (and counts) under each, so you can see which role expects it.
- Nobody drops off. A member with no role skills still gets a card, listed last, that reads “No skills to report yet”.
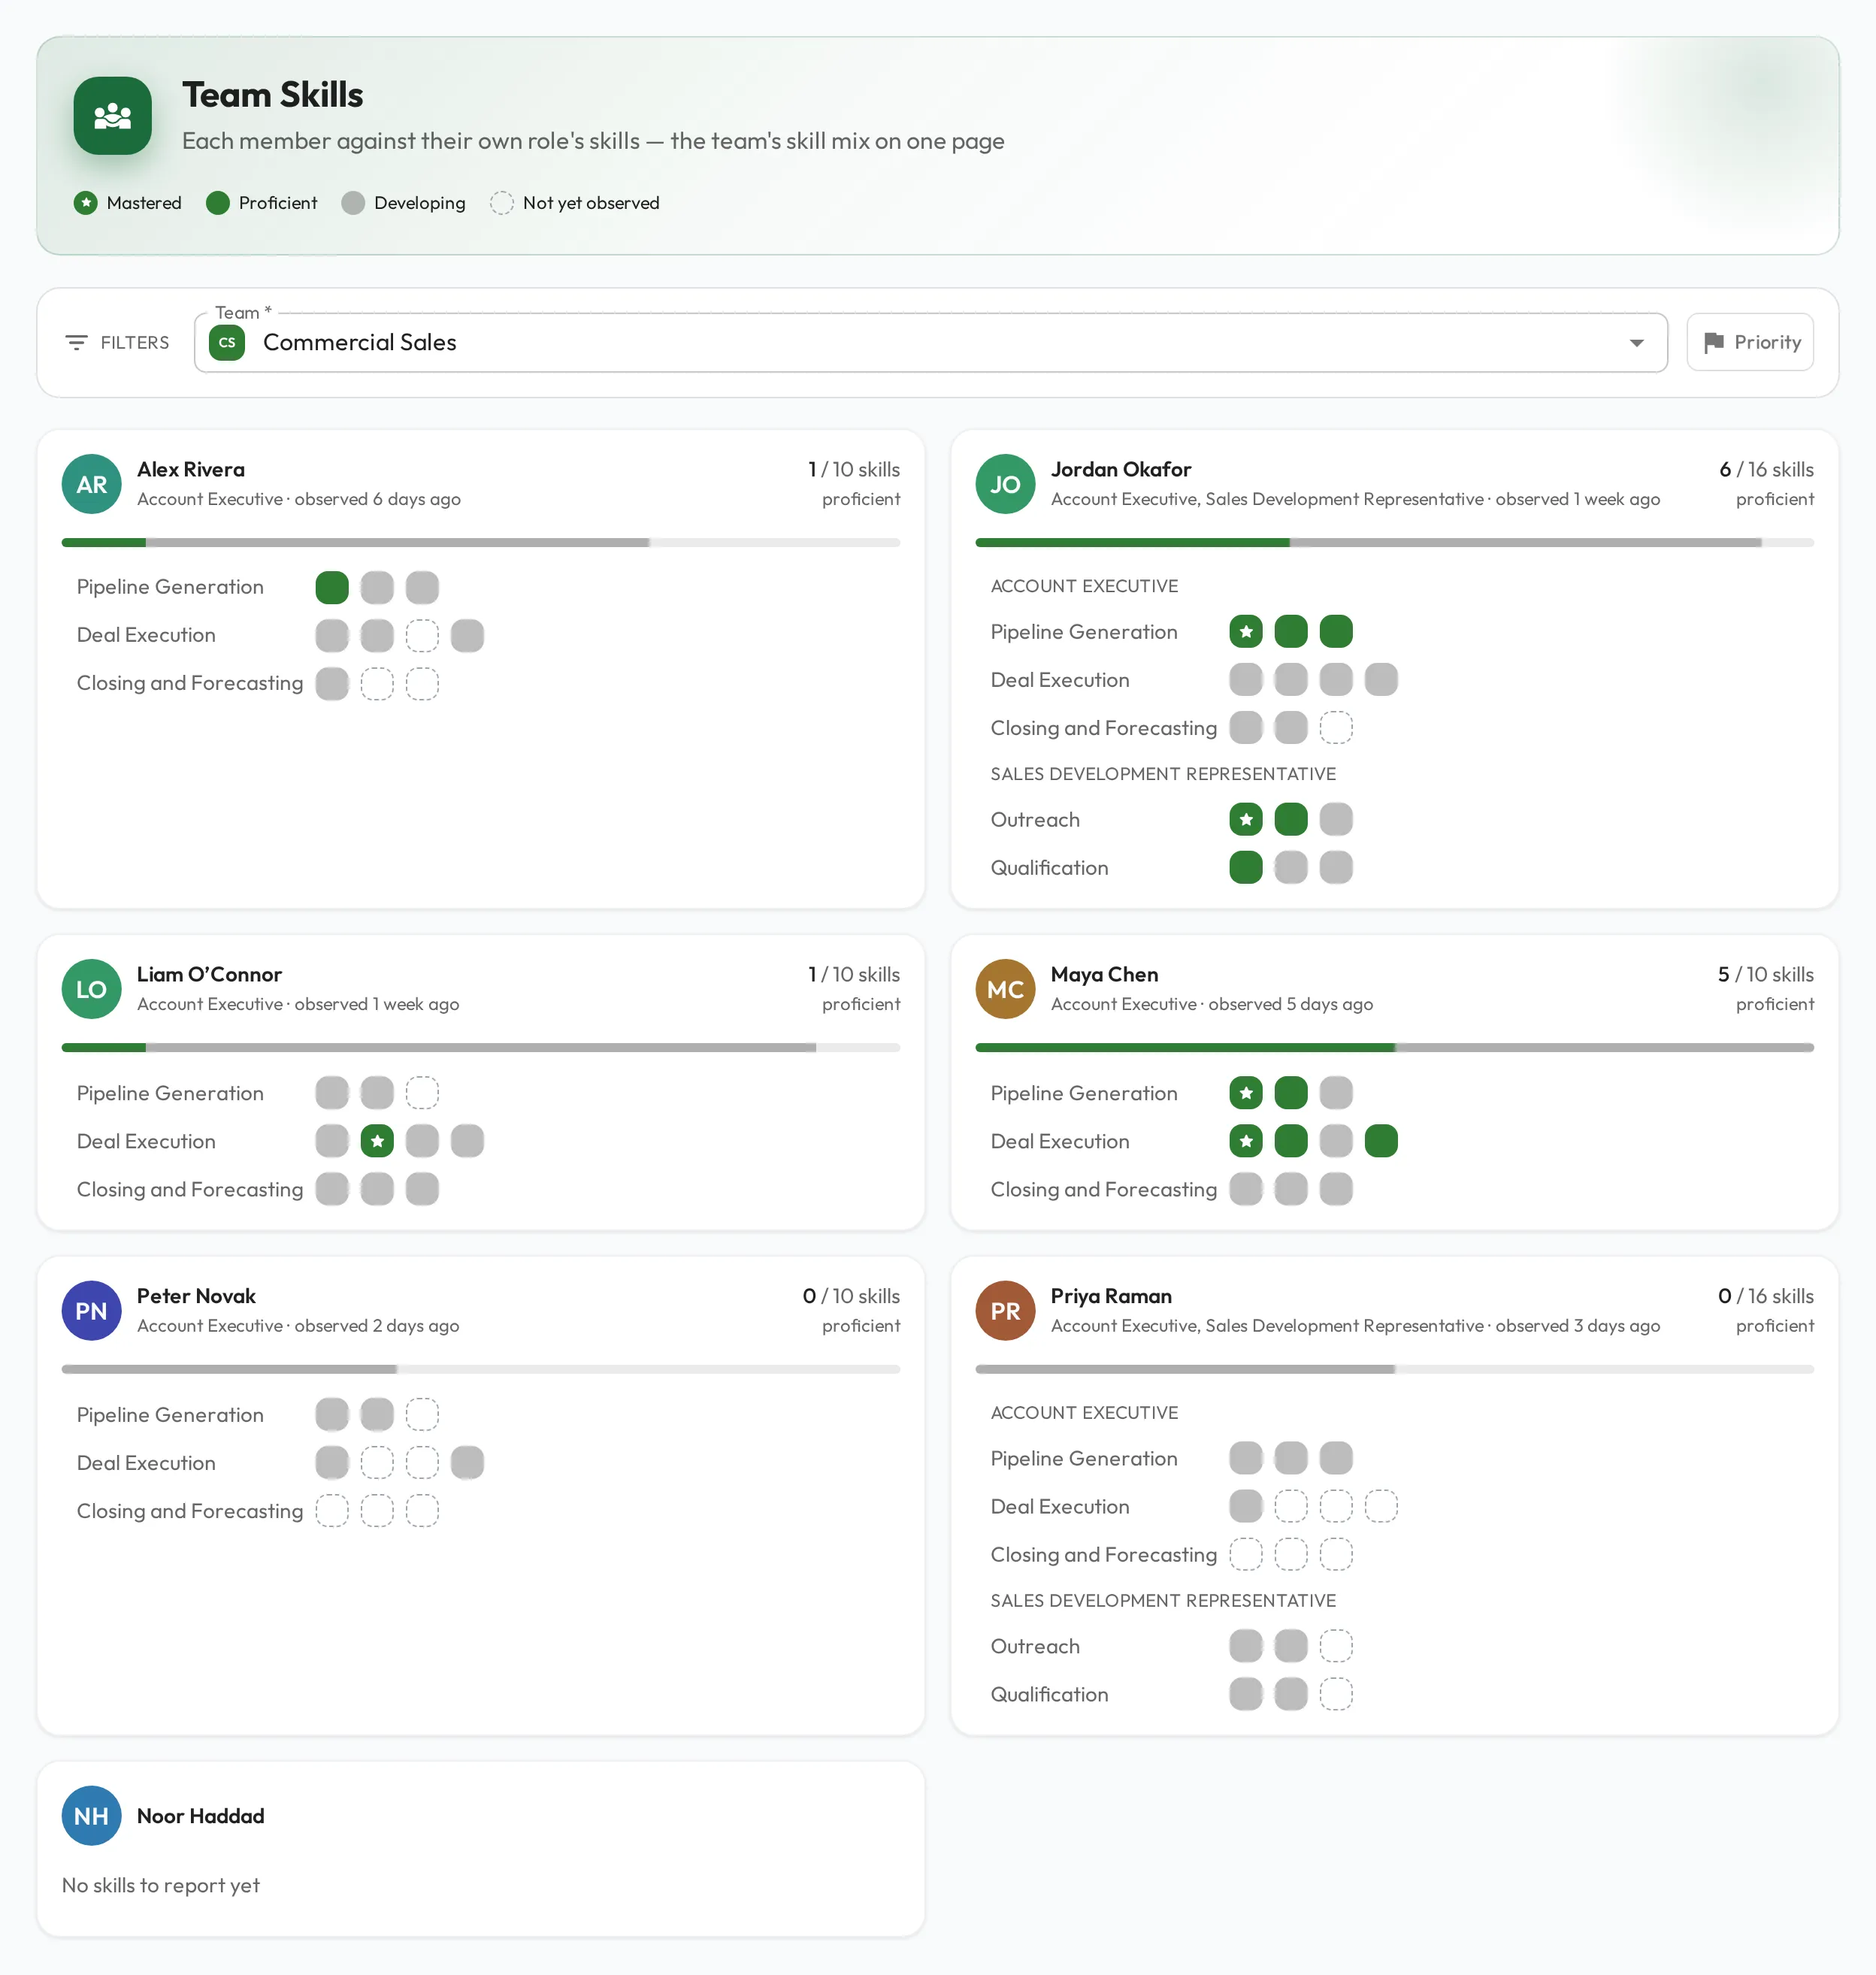
Every square is one skill, in the same four states as the Skills Heatmap’s cells above. From there:
- Compare who shares a skill. Hover or tab to a square, and the same skill is outlined on every card that has it while every other square fades, so you see who holds it and how each person is doing.
- See how close someone is. Hover, tab to or tap a square to open the same card as a Skills Heatmap cell. For a Composite skill, it shows how many of the skills inside it are proficient, and what it needs next in place of a history: all of them Proficient to become Proficient, then all of them Mastered to become Mastered.
- Go deeper. Click the skill’s name in that card to open the skill, or a skillset’s name on the member’s card to open that skillset.
- Read the headline figure. The n / N skills proficient beside each person’s name counts how many of the skills on their card are Proficient or Mastered.
Read each person’s standing
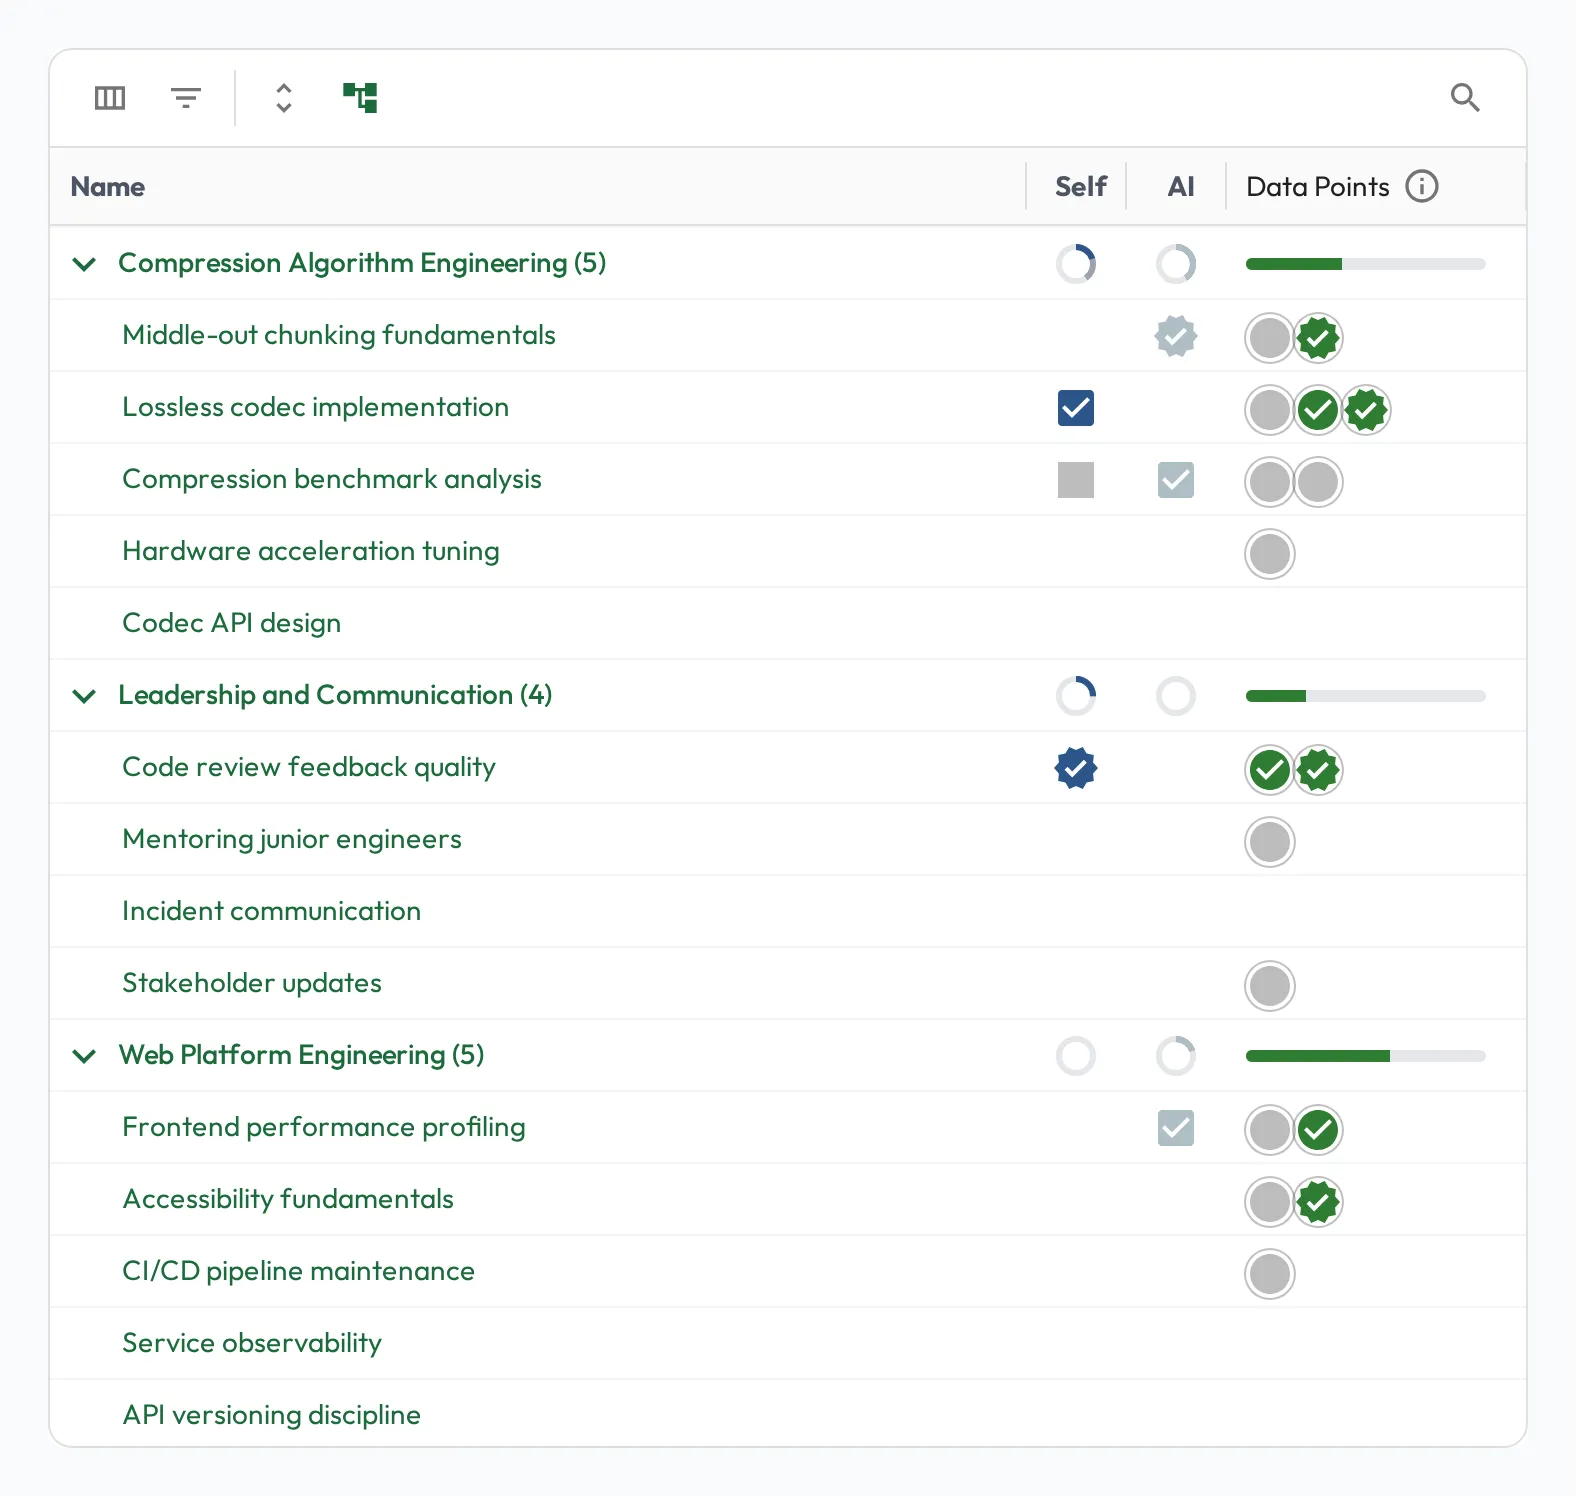
Section titled “Read each person’s standing”Behind that team view sits each person’s skill record: current level and mastery for every expected skill, built from coach (Data Points), self, and AI observations. Open a profile to see exactly where one person is covered and where they’re light, which is where you go once the report points you at someone to develop.
Find the gaps
Section titled “Find the gaps”Reading the team’s skill records against the role’s bar turns “are we ready?” into specific questions:
- Who is below the bar on a required skill? The people in the role not yet proficient in a skill are the ones to coach first.
- Are they improving at a fast enough rate? Even with steady coaching, if someone’s velocity isn’t fast enough for them to reach proficiency in the role, the question shifts from how to coach them to whether this role or team is the right fit.
- What does the team lack collectively? A required skill almost nobody is proficient in is a capability gap to close with hiring or focused coaching.
- Where is bench strength thin? A critical skill held by only one person is a risk worth spreading.
Pair capability with performance
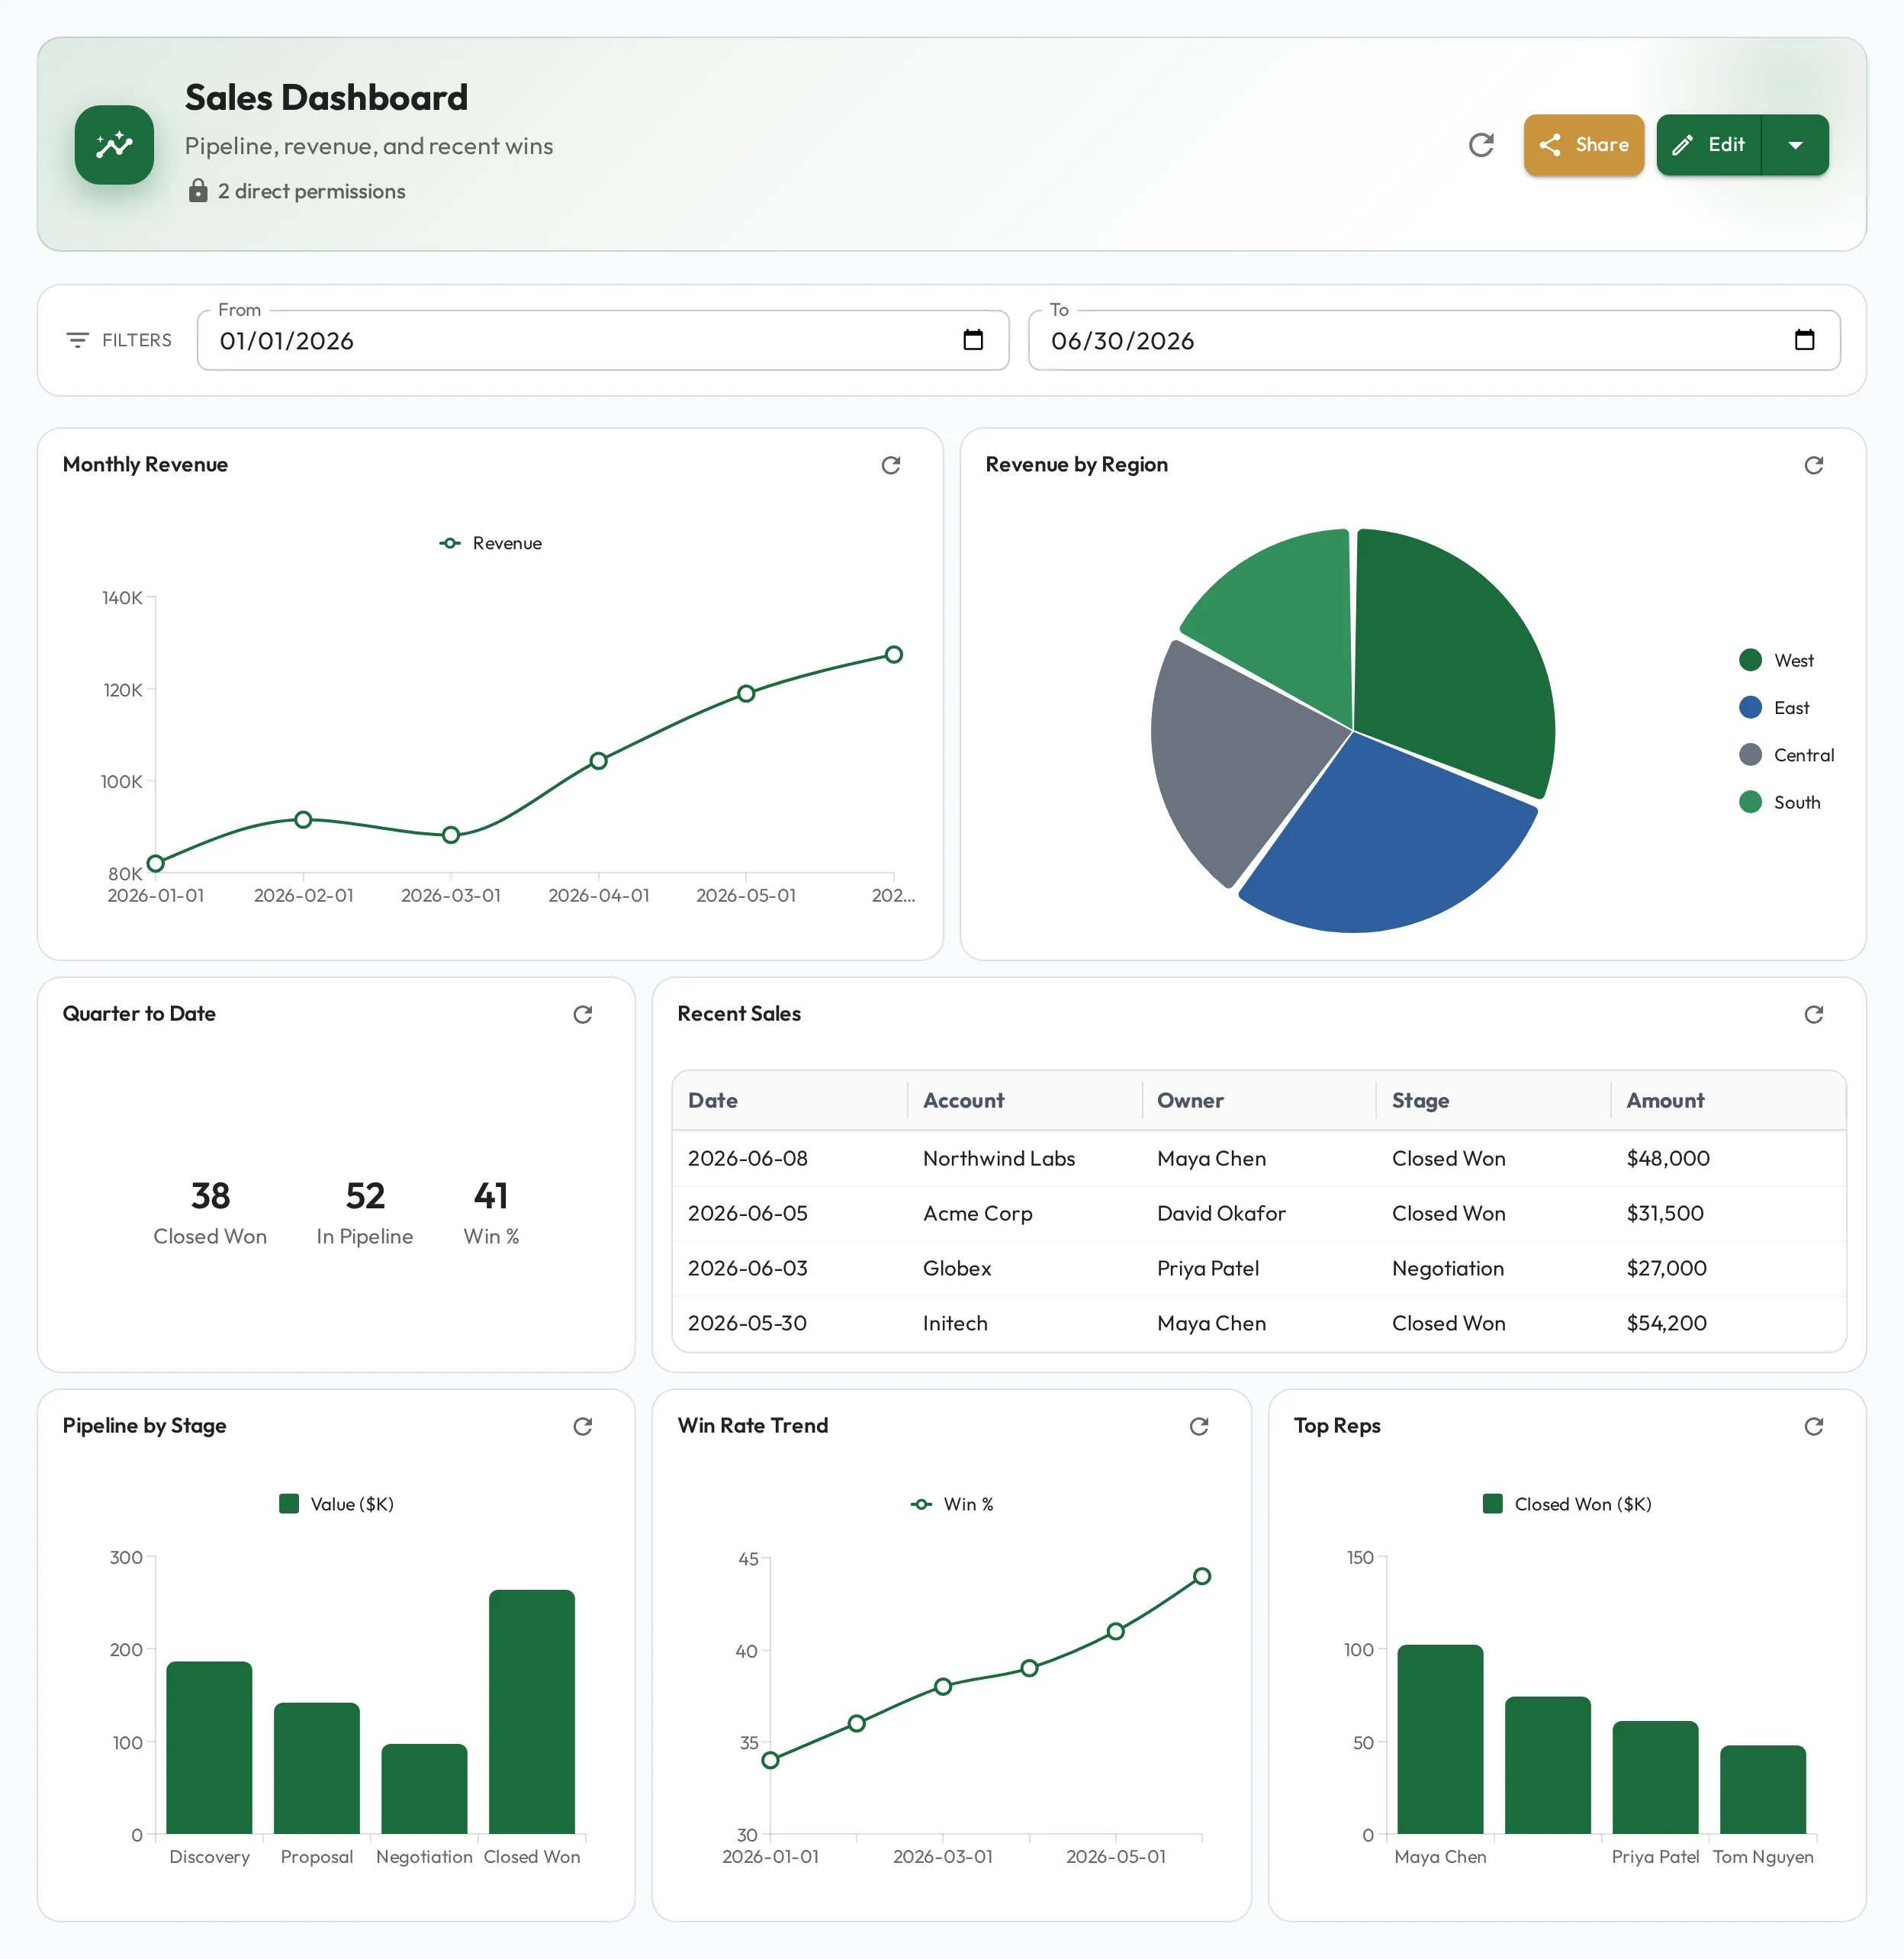
Section titled “Pair capability with performance”Skill standing tells you what a team can do. To see what it’s actually delivering, build a dashboard over the performance data you’ve ingested: throughput, quality, cycle time, whatever the team is measured on. The skill picture and the results picture, read together, answer “is this team ready?” from both sides.