

Role metrics
Role metrics track key performance indicators for a role: the numbers that show whether skill development is translating into results. Unlike a skill observation, which is a discrete, expert assessment captured in a Meeting, a role metric is assessed automatically and continuously from data.
That makes metrics the right tool whenever a performance characteristic can simply be known from a number rather than judged in a session. They’re complementary to skill assessments: the metric gives staff faster feedback (it updates as the data does) with no overhead for coaches (nobody has to sit down and score it), freeing coaching time for the things that genuinely need a human eye.
Use cases
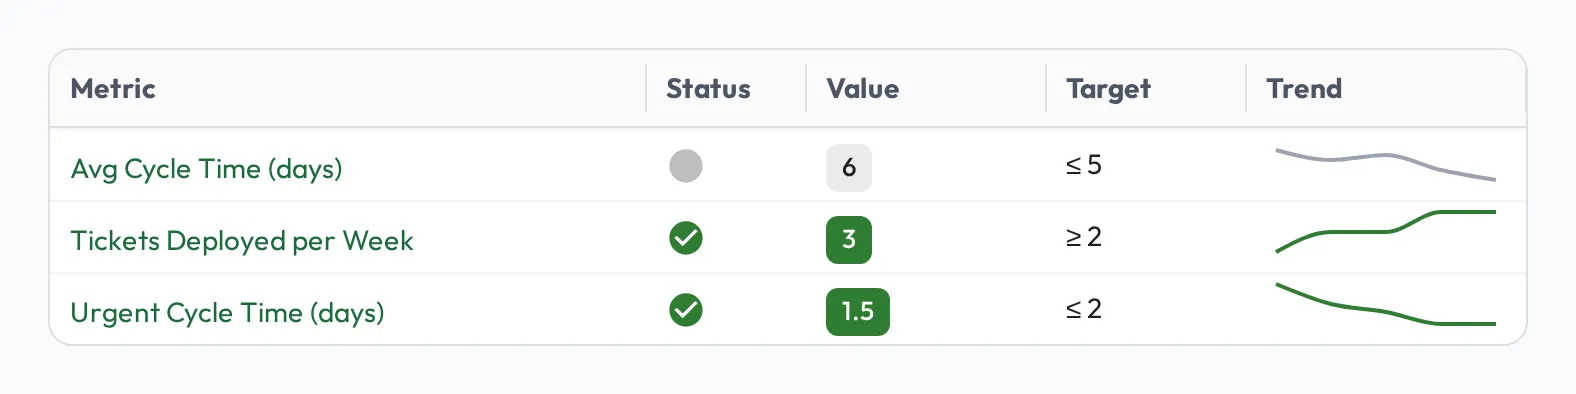
Section titled “Use cases”- KPIs: give staff continuous feedback on the numbers that define their role: average sales deal size, tickets delivered, cycle time, response time, revenue. As the underlying data updates, so does each person’s sparkline; no one has to stop and tally it.
- Continuous AI insights: use Admire’s AI to turn unstructured work into measurable signals, then track them as metrics. For example, run a preliminary pass over call or meeting transcripts to gauge sentiment or surface the key topics discussed, and watch those trend per person over time. (See artifact processing for computing these signals from your data.)
How it works
Section titled “How it works”Attach a metric to a role and give it:
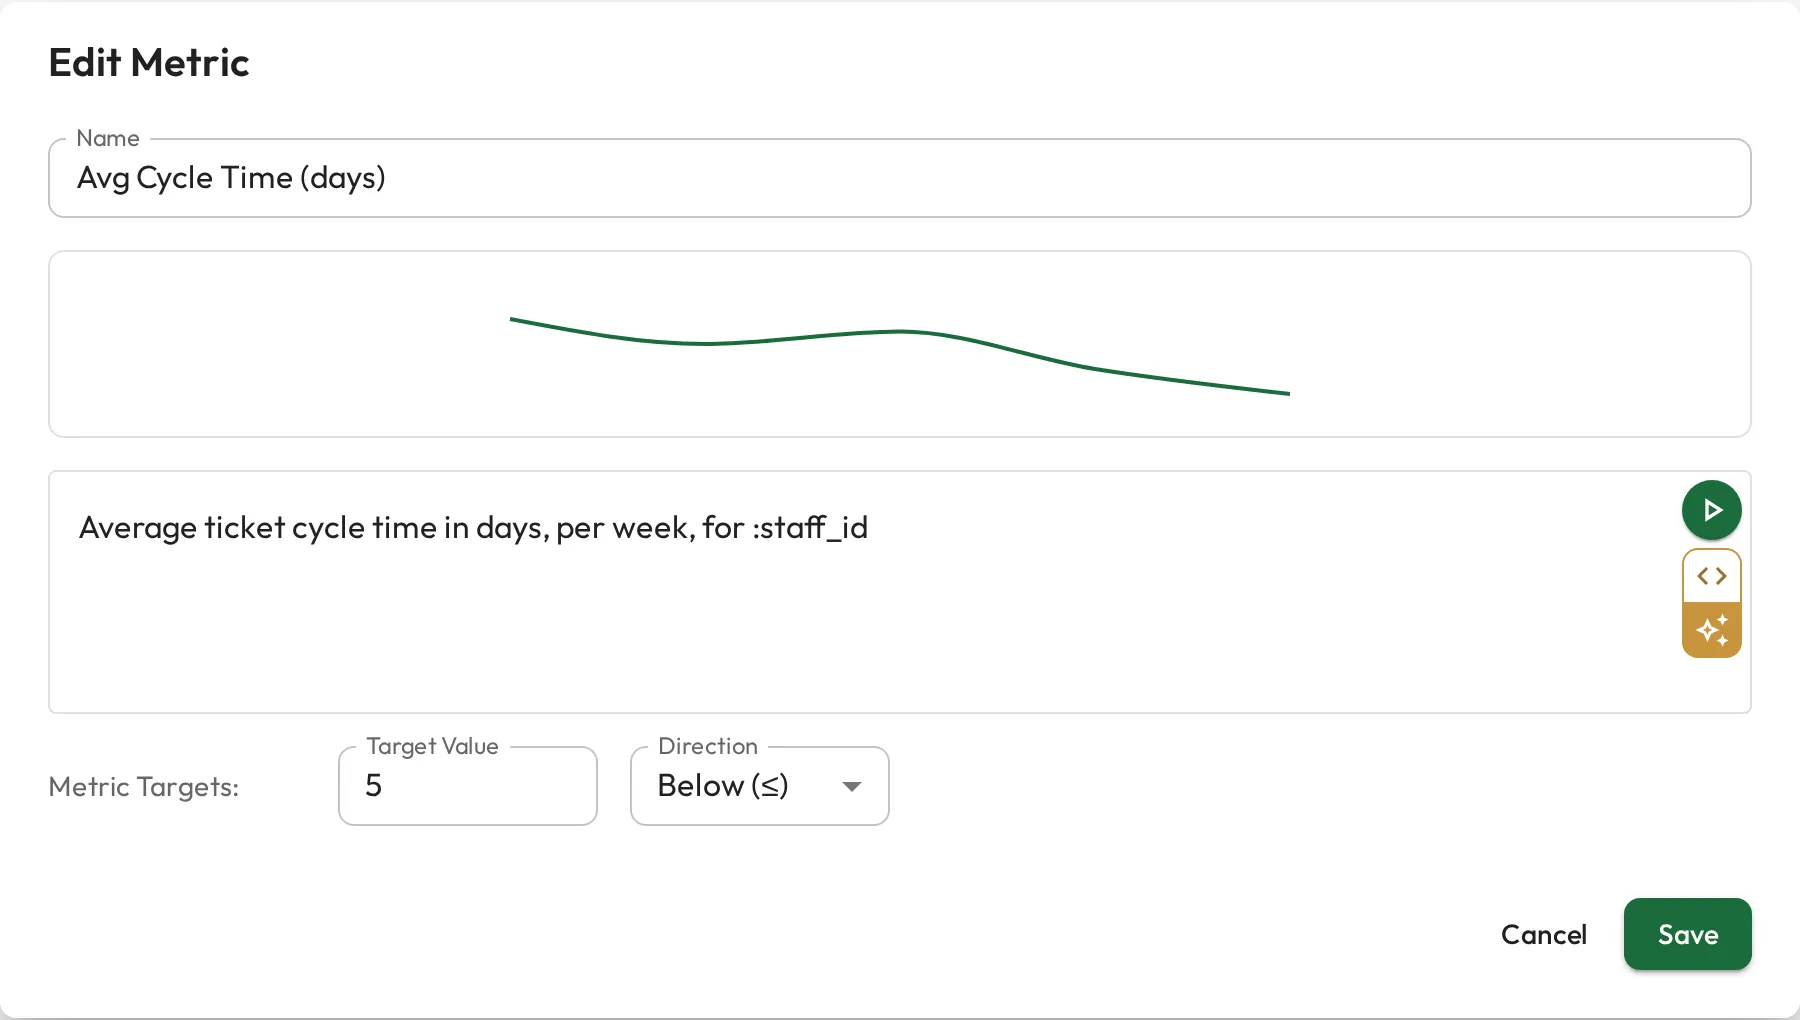
- a target value, and a direction: whether higher, lower, or exactly on target is good.
- the query that produces its value (see below).
On each person’s profile, the metric shows a sparkline of the value over time, colored by status (on-track vs. off-track) based on how they’re tracking against the target, so you can scan a team and see at a glance who needs attention.
The query behind a metric
Section titled “The query behind a metric”A metric is powered by a query over your artifact data. You can write it in plain English and let Admire generate the SQL, or write the SQL directly; both stay in sync, so pick whichever is easiest and toggle to the other at any time.
The query must:
- filter by
:staff_id, so Admire can run it per person: compare it to the column that holds the person, as inWHERE assignee_id = :staff_id, - use only artifact sources you have access to, and
- return a time series: a date column and a numeric value column.
Admire checks the first two when you save. A query that only mentions :staff_id would show everyone the whole organization’s numbers, so it is refused.
A few examples to give a sense of the range (toggle each between English and SQL):
Average ticket cycle time in days, per week, for :staff_id
SELECT date_trunc('week', closed_at) AS week, AVG(cycle_days) AS avg_cycle_daysFROM ticketsWHERE assignee_id = :staff_idGROUP BY weekORDER BY week Total revenue from deals closed by :staff_id, per month
SELECT date_trunc('month', closed_at) AS month, SUM(amount) AS revenueFROM dealsWHERE owner_id = :staff_idGROUP BY monthORDER BY month Median first-response time in minutes for tickets handled by :staff_id, per week
SELECT date_trunc('week', created_at) AS week, PERCENTILE_CONT(0.5) WITHIN GROUP (ORDER BY first_response_minutes) AS median_responseFROM ticketsWHERE assignee_id = :staff_idGROUP BY weekORDER BY weekMetrics vs. skill assessments
Section titled “Metrics vs. skill assessments”- Role metrics: continuous, automatic, and data-driven. Best for outcomes you can measure (tickets closed, response time, revenue).
- Skill assessments: discrete, expert judgments of observed behavior. Best for capabilities that need a human to evaluate.
Used together, they connect what people do to the results it produces.