

Querying your data (SQL)
Once data is in an artifact source, queries turn it into the numbers behind your dashboards and role metrics. Each source behaves like a table you can select from, named by the source, with the columns you defined.
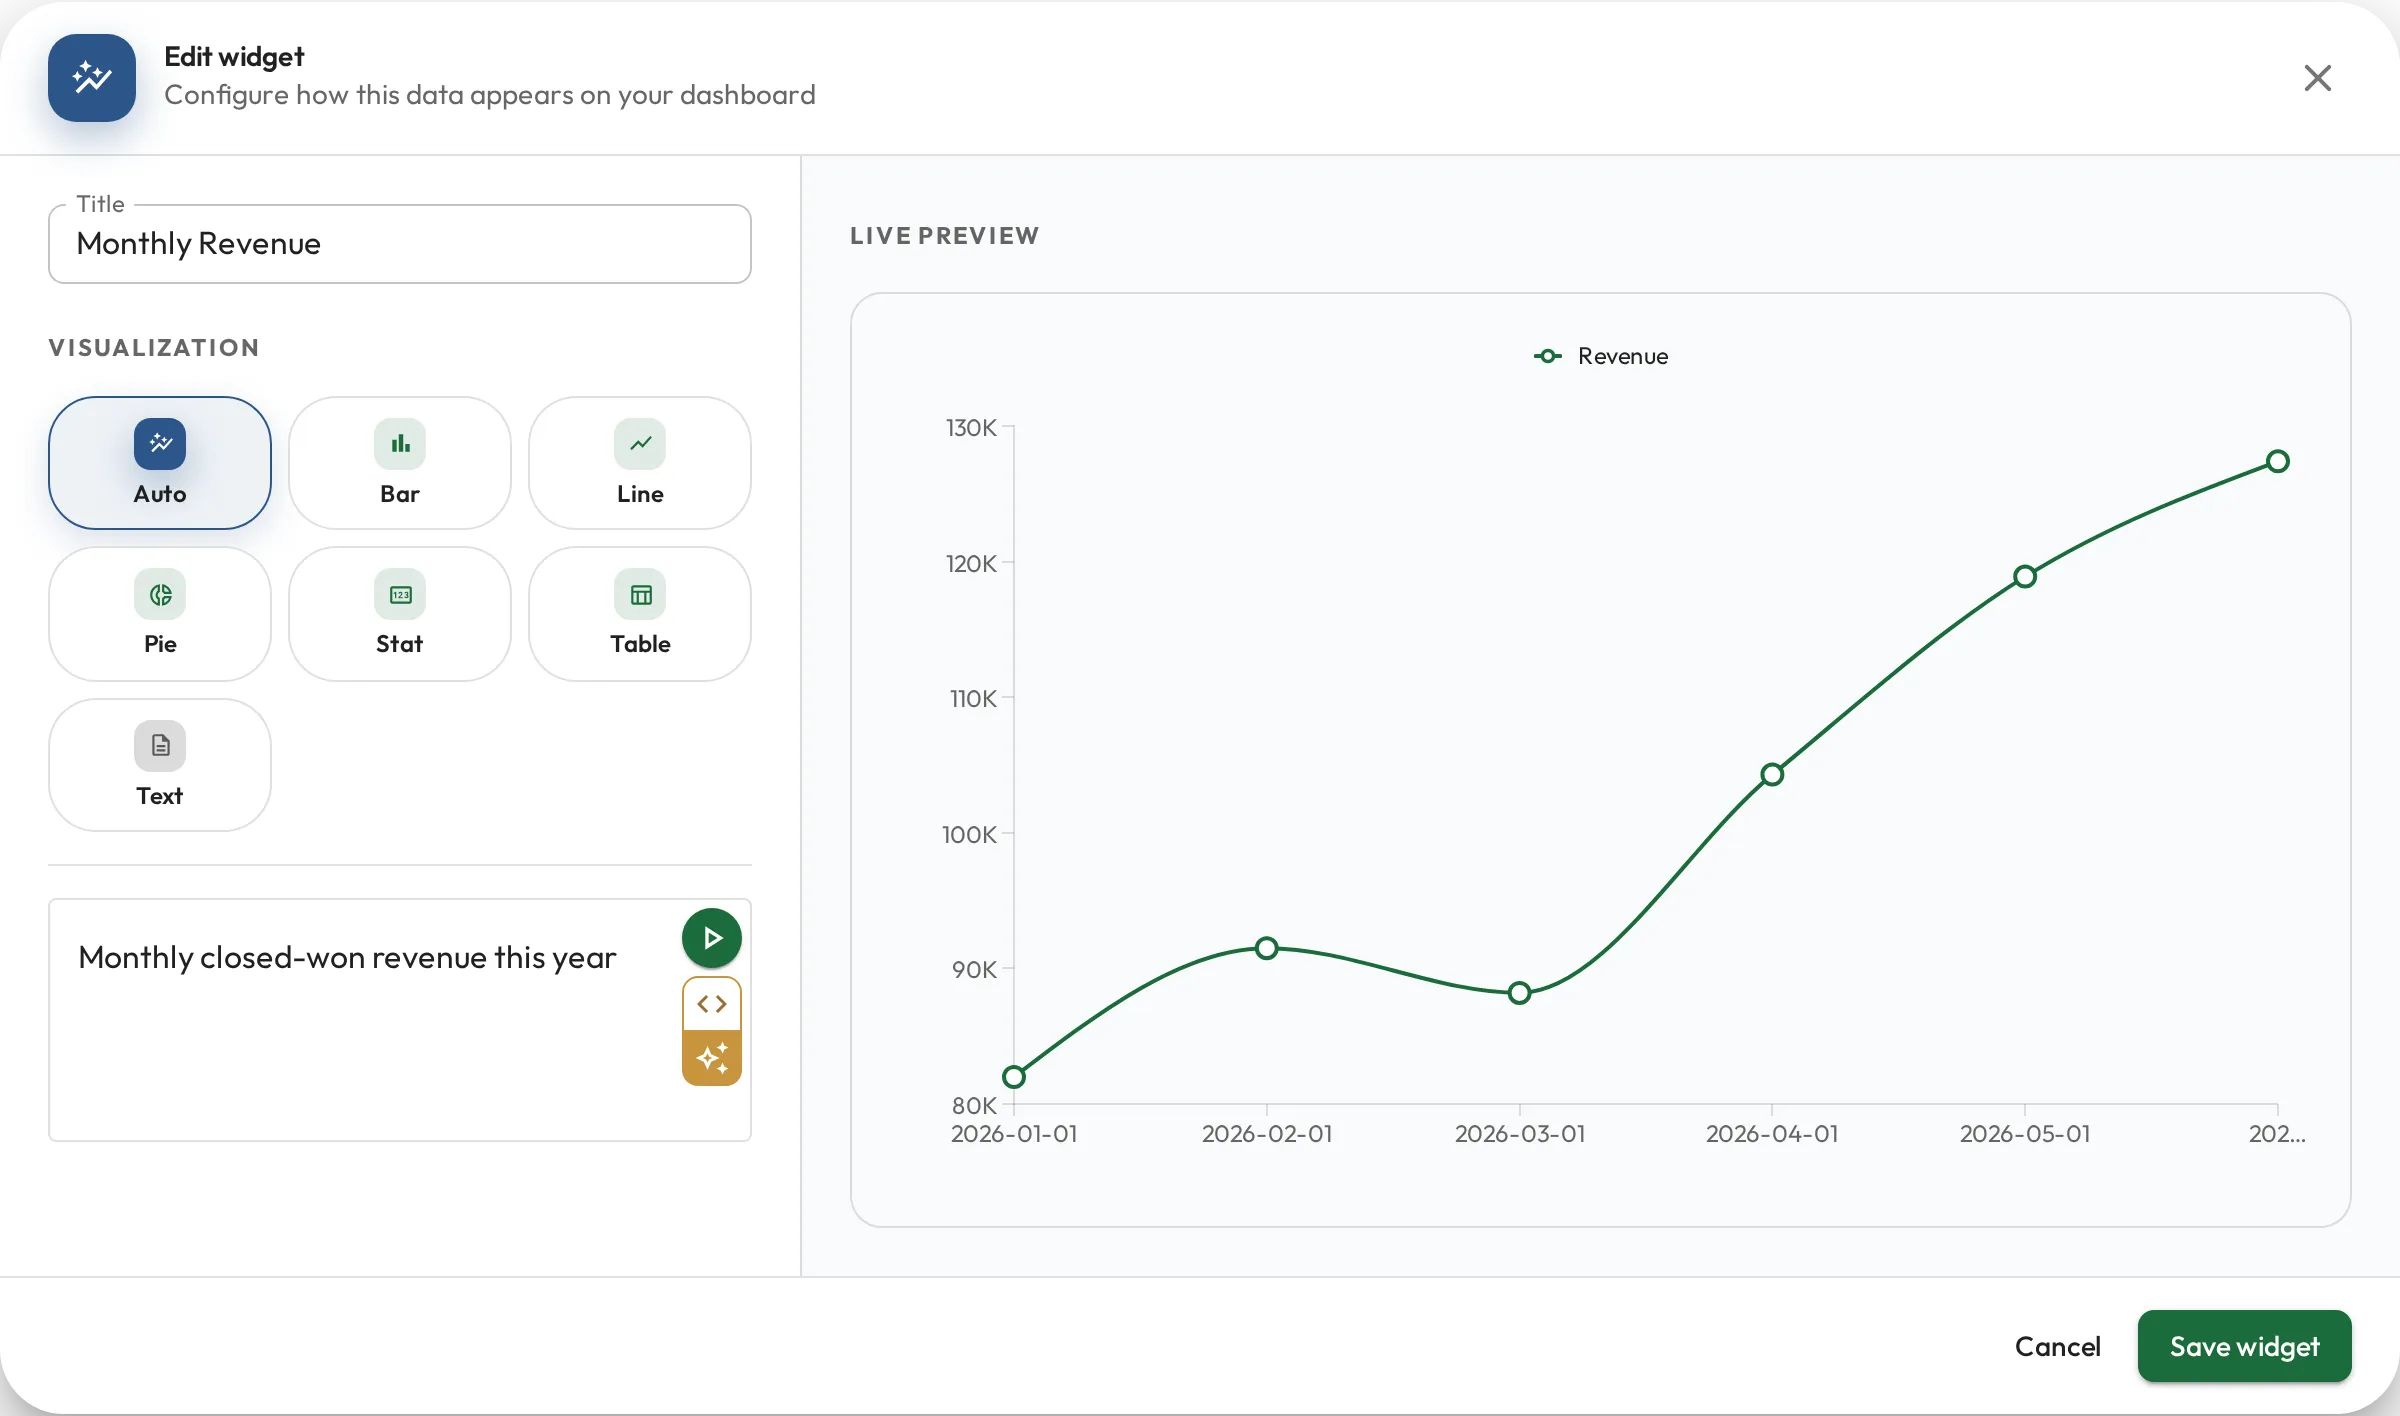
Query in English or SQL
Section titled “Query in English or SQL”You don’t need to know SQL to query your data. Wherever you write a query (a dashboard widget or a role metric), you can work in two modes:
- English mode: describe what you want in plain language and Admire drafts the query for you. It knows your sources’ tables and columns, so the result usually just works.
- SQL mode: write or fine-tune the query yourself.
The two stay in sync, so a good way to work is to start in English to get a correct query fast, then switch to SQL to adjust it if you want more control. You can move between the two at any time.
Closed deals per month, broken down by stage
SELECT date_trunc('month', closed_at) AS month, stage, count(*) AS dealsFROM dealsGROUP BY 1, 2ORDER BY 1A safe subset of SQL
Section titled “A safe subset of SQL”Queries are read-only SQL, a deliberately limited subset of PostgreSQL:
SELECTonly: no inserting, updating, or deleting data.- An approved list of functions and casts: the common ones for reporting, such as aggregate, window, date, string, math and JSON functions.
- Your organization’s data only: a query never sees another organization’s data.
- A time limit: a query that runs too long is stopped.
It’s safe to let anyone explore data with a query.
Variables
Section titled “Variables”A query can take variables (:name placeholders you fill in at run time) so one query answers many questions:
Pull requests per day since :start_date
SELECT created_at::date AS date, count(*) AS prsFROM github_prsWHERE created_at > :start_date::timestamptzGROUP BY 1ORDER BY 1- Dashboards supply variables through interactive controls (a date picker, a team selector, and so on). See Dashboards.
- Role metrics must include a
:staff_idvariable; Admire runs the query per person, filling in each staff member’s ID. See Role metrics.
Examples
Section titled “Examples”A grouped count for a dashboard chart:
Count of pull requests by state
SELECT state, count(*) AS totalFROM github_prsGROUP BY stateA per-person time series for a role metric (date + value, scoped by :staff_id):
Tickets closed per day by :staff_id
SELECT closed_at::date AS date, count(*) AS tickets_closedFROM support_ticketsWHERE assignee_id = :staff_idGROUP BY 1ORDER BY 1